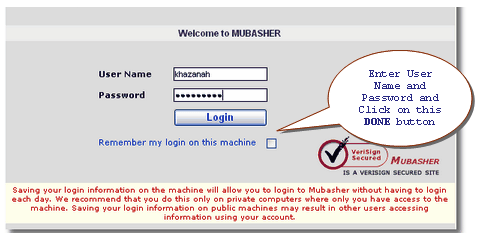
Once you access Mubasher Net home page, enter your login information to access the Mubasher Net Service.
Note:
To use Mubasher Net service, you need to be connected to the Internet through any ISP. If you are unable to connect to the Internet, please contact your Internet service provider, or contact Mubasher Help Desk as per the contact details given here:
The Market Summary on the top gives the summary information of trading activity of any selected exchange.

| Selected Exchange - The Exchange selected | ||
| Symbols Traded - Cumulative number of symbols traded during the day | ||
| Trades - Cumulative number of trades during the day | ||
| Volume - Cumulative volume traded for the day | ||
| Turnover (Value Traded) - Cumulative value of shares traded during the day |

Selected Exchange - Indicates the Stock Exchange you have selected. You can click here to view the list of exchanges that you have subscribed for. |
||||||||||||||||||
Market Status - Indicates Stock Market status at the time (Pre-Open, Open, Pre-Close or Close). |
||||||||||||||||||
Date & Time - Selected Exchange’s current date & time. |
||||||||||||||||||
All Share Index Volume – The Current All Share Index Volume. |
||||||||||||||||||
All Share Index – The Current value of the selected stock market main Index together with its change and % change for the day, with the trade tick. |
||||||||||||||||||
Status Bulbs – There are two status Bulbs to indicate connections. First Bulb indicates if you are connected to the price server or not and the second indicates whether you are connected to the trade server or not. If you move the mouse over these bulbs you can see the Tool Tip with the correct status. |
||||||||||||||||||
|
||||||||||||||||||
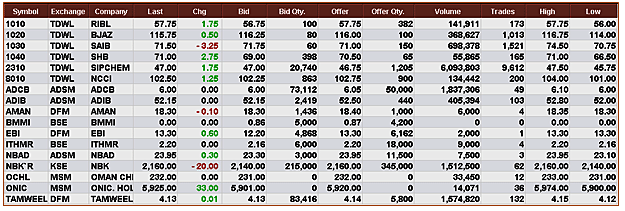
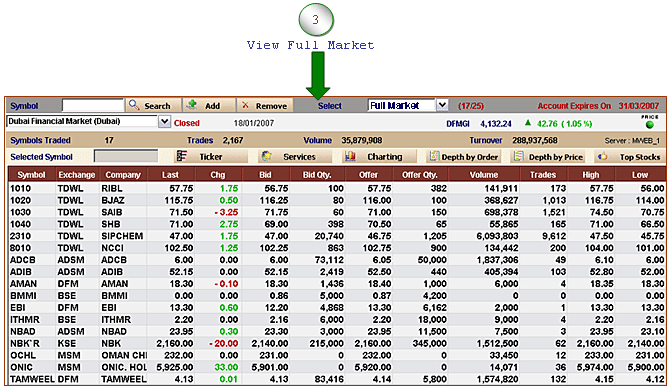
Once you add symbols to the Watch List, real-time market information for those symbols will be displayed on the Main Board.
| Symbol – Symbol of Security | ||
| Exchange –Exchange which the symbol belongs to | ||
| Company - Short description of the company | ||
| Last - Price at which the symbol was last traded | ||
| Chg. - Net change for the day (Net Change = Last Traded Price - Previous Close) | ||
| Bid - Highest Bid price in the market | ||
| Bid Qty. - Quantity associated with the highest bid price (may be from multiple orders) | ||
| Offer - Lowest Offer price in the market | ||
| Offer Qty. - Quantity associated with the lowest offer price (may be from multiple orders) | ||
| Volume - Numbers of shares for the symbol traded for the day | ||
| Trades - Number of trades for the symbol for the day | ||
| High - Highest trading price for the symbol for the day | ||
| Low - Lowest trading price for the symbol for the day |
When the market is in Pre-open or Open state, information on the board change dynamically. The information which change will be highlighted in red and green for easy identification.
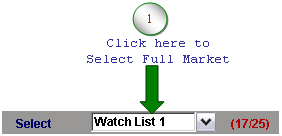
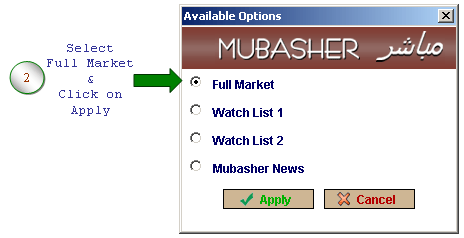
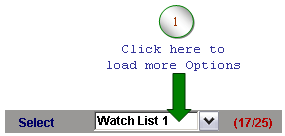
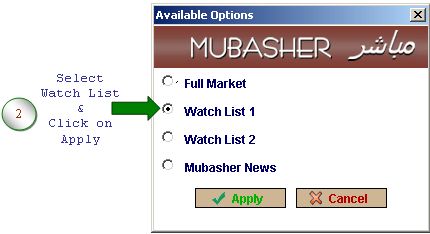
Full Market option displays on the Main Board, all the Symbols enlisted in the selected exchange, including symbols which were not traded for the day. By default Watch List 1 is displayed on the Main Board. To select Full Market, click on the Main Board dropdown and select Full Market from the options invoked.
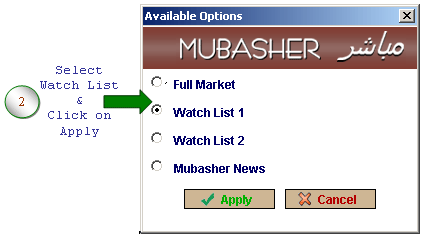
Mubasher Net Net allows you to add symbols to two different pre-created Watch Lists termed Watch List 1 and Watch List 2. By default, both the Watch Lists are empty and a maximum of 25 symbols can be added to the Watch Lists. The Watch List feature allows you to monitor the movement of 25 stocks concurrently.
To add your favorite stocks to the pre-created Watch List, you need to select either Watch List 1 or Watch List 2 and Add Symbols to it.

Simply enter the symbol and press Add to include the symbol in the current watch list. Multiple symbols can be added by typing the relevant symbol codes leaving a space in between each symbol code. E.g.: 1010 1020.

If you do not know, or cannot remember the symbols you want to add to the Watch List, use the Search Symbol feature.
If you want to remove a symbol already added to the watch list, simply click on the symbol and press remove.

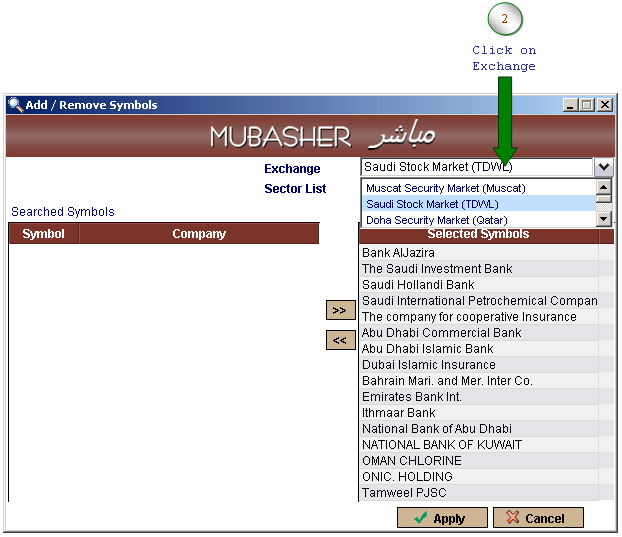
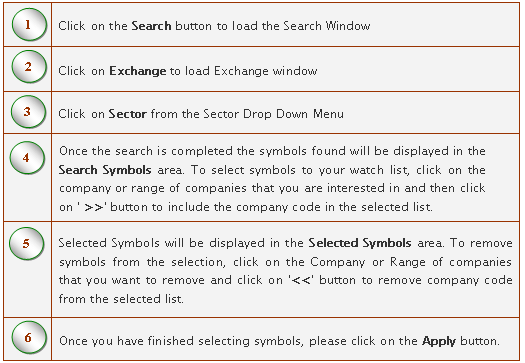
Symbol search is useful when you do not know, or cannot remember the symbols you want to add to the Watch List. Using Symbol search, multiple symbols can be selected in one go and added to the Watch List.

The Select Exchange window displays the list of exchanges that you have subscribed for. To select an exchange, click on the desire Exchange and click on the Apply button.
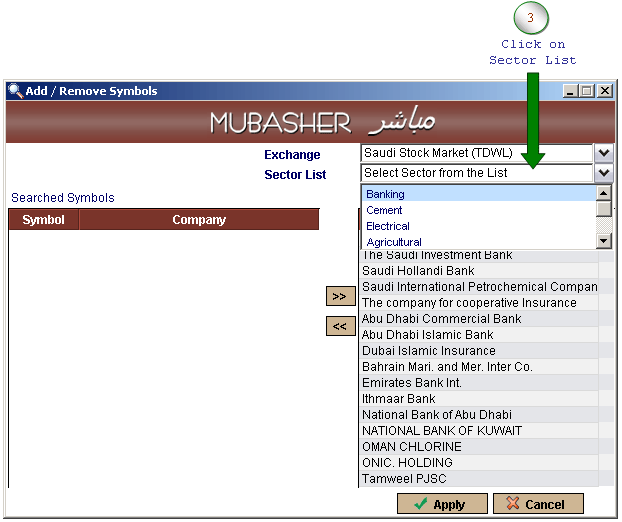
The Select Sector window displays the list of Sectors available. To select a sector, click on the Sector desired and click on the Apply button.
All trades for the selected exchange or selected symbols for multiple exchanges are displayed in real-time Trade Tickers. You can view the Ticker by selecting the Ticker option from the Top Panel.


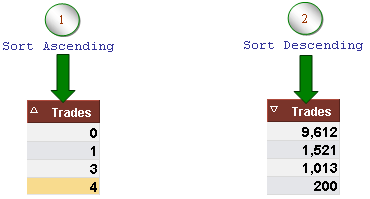
The columns on the Mubasher Net Main board can be easily sorted in an ascending or descending order. To sort a column, click on the column header and an arrow will be displayed according to the order sorted.
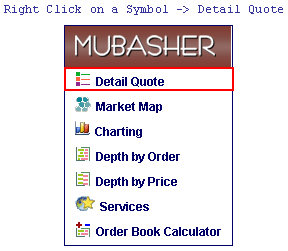
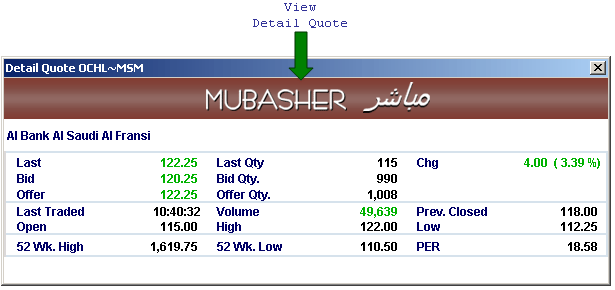
If you wish to view more detailed information about a company, simply double click on the Symbol row to load the Detailed Quote or select the Detail Quote Option from the Right Click Popup.
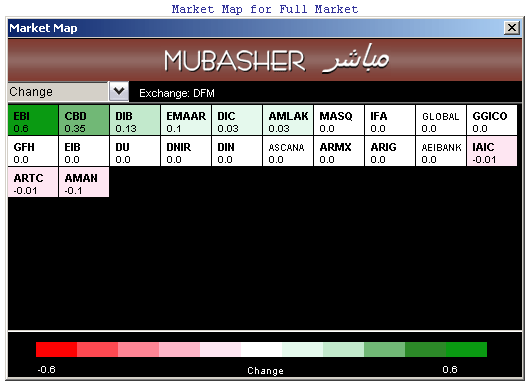
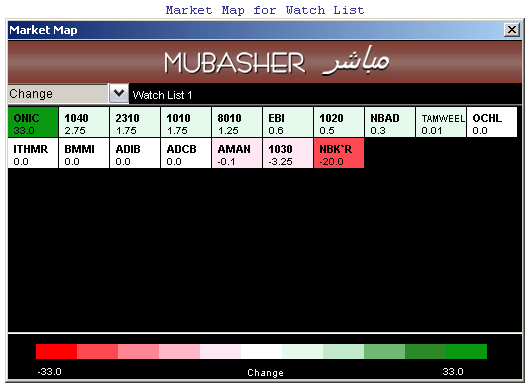
- Red indicates that the value is dropping
- Green/Blue indicates that the value is booming
- White indicates the neutral value
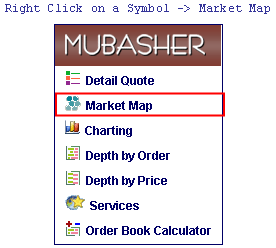
To set the Market Watch, right click on any Watch List symbol and then select the Market Map option from the Right Popup menu. Please select the Criteria and the Exchange you want to spot the information for, from the drop down menu.
- P/E Ratio
- % Change
- Market Cap – Millions
- # Trades
- Volume ‘000
- Bid/Offer ratio
- Range
- % Range
- Spread
- % Spread
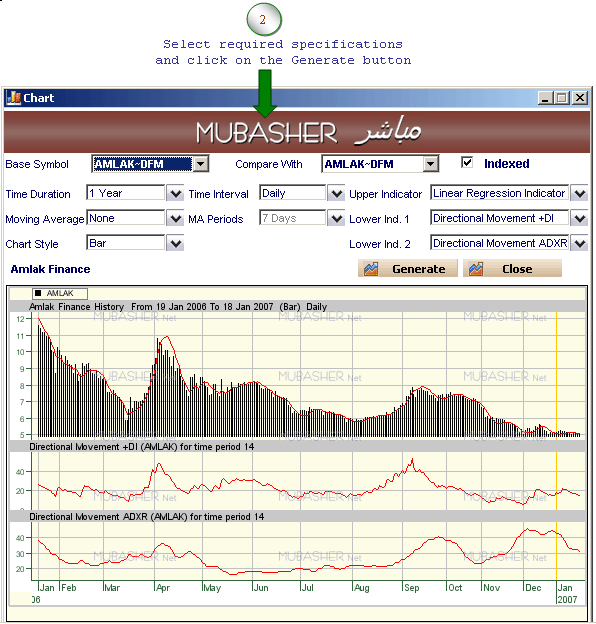
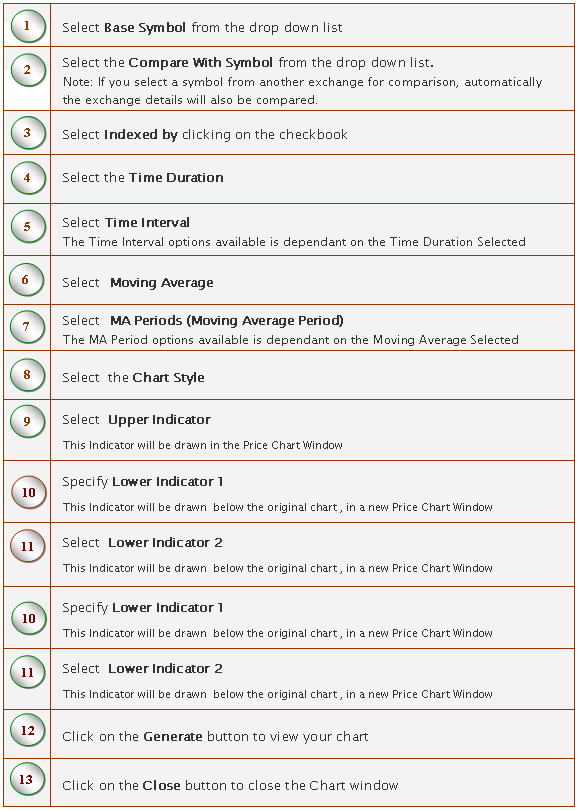
Mubasher Net Net provides you with graphical analysis of the stock market information. By default the graph will drawn for any symbol selected from the Main Board. If you are displaying a graph for only one Base symbol, then please add the same symbol in the Compare With field.


Mubasher Net Net allows you to access real-time Level II information or Order book information for subscribed exchanges. For most active investors Level 1 information displayed on the main board is not sufficient to make investment decisions therefore, exchanges disseminate the order book for each company, in two different formats.
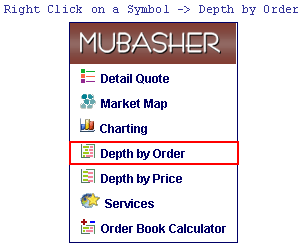
To access the market depth by order, click on the Depth by Order option from the Top Panel. You can either Search for a symbol and click on show Market Depth to view Market Depth by order, or on the other hand if you remember the symbol, type Symbol ~ Exchange eg: 1010~TDWL and click on show Market Depth.

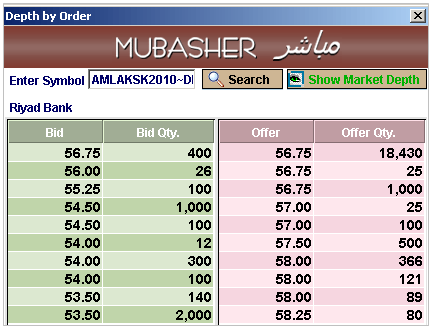
Bid and Offer orders will be grouped by prices and the best 10 levels will be displayed.
| Bid/Offer Price - This is the bid price level, one on top is the highest bid/lowest offer | ||
| Bid/Offer Qty - This is the cumulative quantity offered under each of the bid/offer price | ||
| Splits - Number of orders at each bid/offer price level |
For easy reference of information all bid information is highlighted in Green and the offer information is highlighted in Pink.
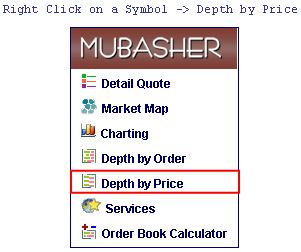
To access the market depth by price, click on the Depth by Price option from the Top Panel. You can either Search for a symbol and click on show Market Depth to view Market Depth by Price, or on the other hand if you remember the symbol, type Symbol ~ Exchange e.g.: 1010~TDWL and click on show Market Depth.

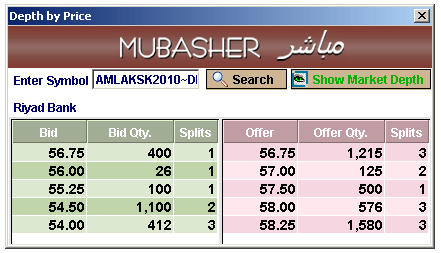
| Bid/Offer Price - This is the bid price level, one on top is the highest bid/lowest offer | ||
| Bid/Offer Qty - This is the cumulative quantity offered under each of the bid/offer price | ||
| Splits - Number of orders at each bid/offer price level |
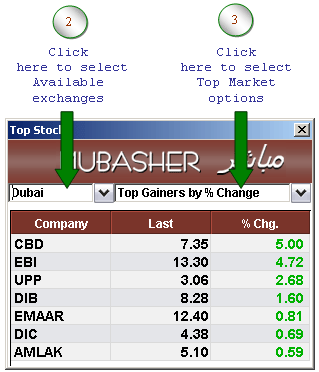
Top Stocks provide the latest top market price information for the selected exchange. You can select the Top Stocks option from the Top Panel.

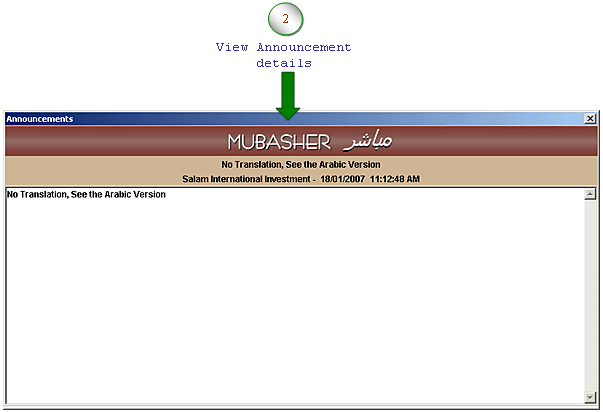
Mubasher Net gives you the announcements made by companies you have subscribed for, to keep you well informed and take appropriate investment decisions.
Announcements are displayed in a summarized manner on the Top Panel. All the announcements available for the day are displayed, but if there are no announcements for the day, the latest 4 announcement are displayed. The detailed announcements can be accessed by simply clicking on the relevant announcement.

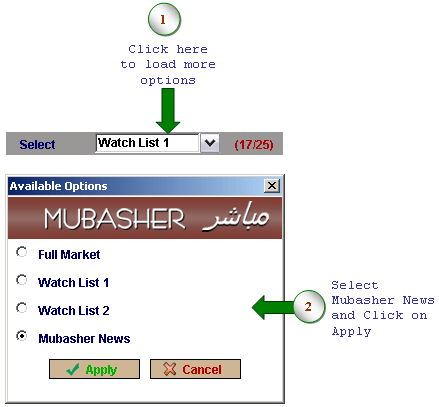
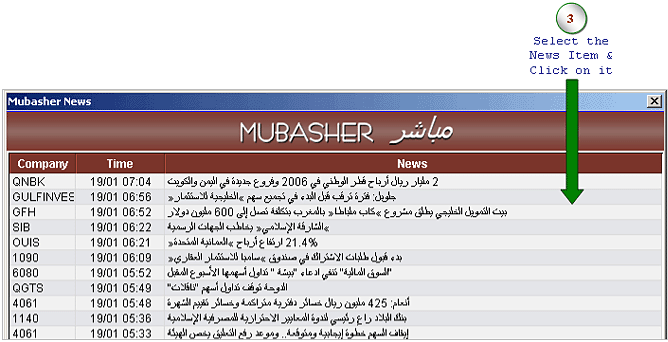
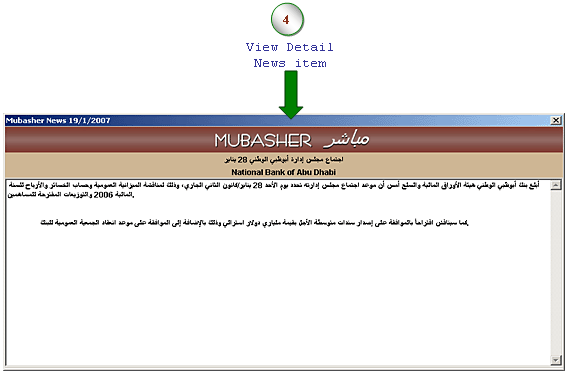
Mubasher Net gives you latest news regarding companies enlisted in the stock exchanges you have subscribed for, to keep you well informed and take appropriate investment decisions.
Mubasher Net provides access to several Value Added Services (VAS), to guide investors to make sound investment decisions.
- Company Financials
- Company Profile
- Financial Calendar
- Companies Directory
- Sites Directory
- Brokerage Companies
- Investment Dictionary
- Mubasher Tutorial
To access Mubasher Services pertaining to an Exchange, select Services from the Top Panel.

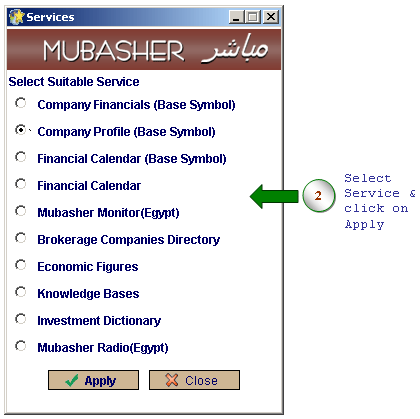
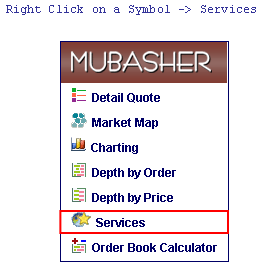
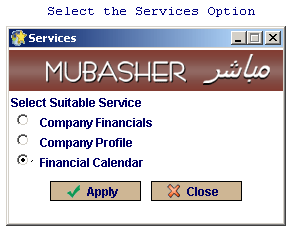
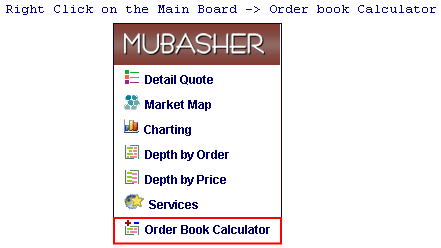
To access Mubasher Services pertaining to an Exchange, Right Click on the Main Board and select Services option from the Right Popup menu.
Click on the Logout link on the bottom panel to logout of the system. We recommend you to logout of Mubasher Net each time you finish monitoring the market.

This is the date on which your account will expire. Your account could expire within one month, three months etc, from the date of activation of the card, depending on the time period you selected during the subscription of the service. For continued access please purchase new card, or renew your account prior to expiry.